U.S. Cities With Highest Share of Families in Poverty
This was originally posted on our Voronoi app. Download the app for free on iOS or Android and discover incredible data-driven charts from a variety of trusted sources.
High poverty rates continues to be a pressing issue in several U.S. metropolitan areas, especially in the South and Southwest.
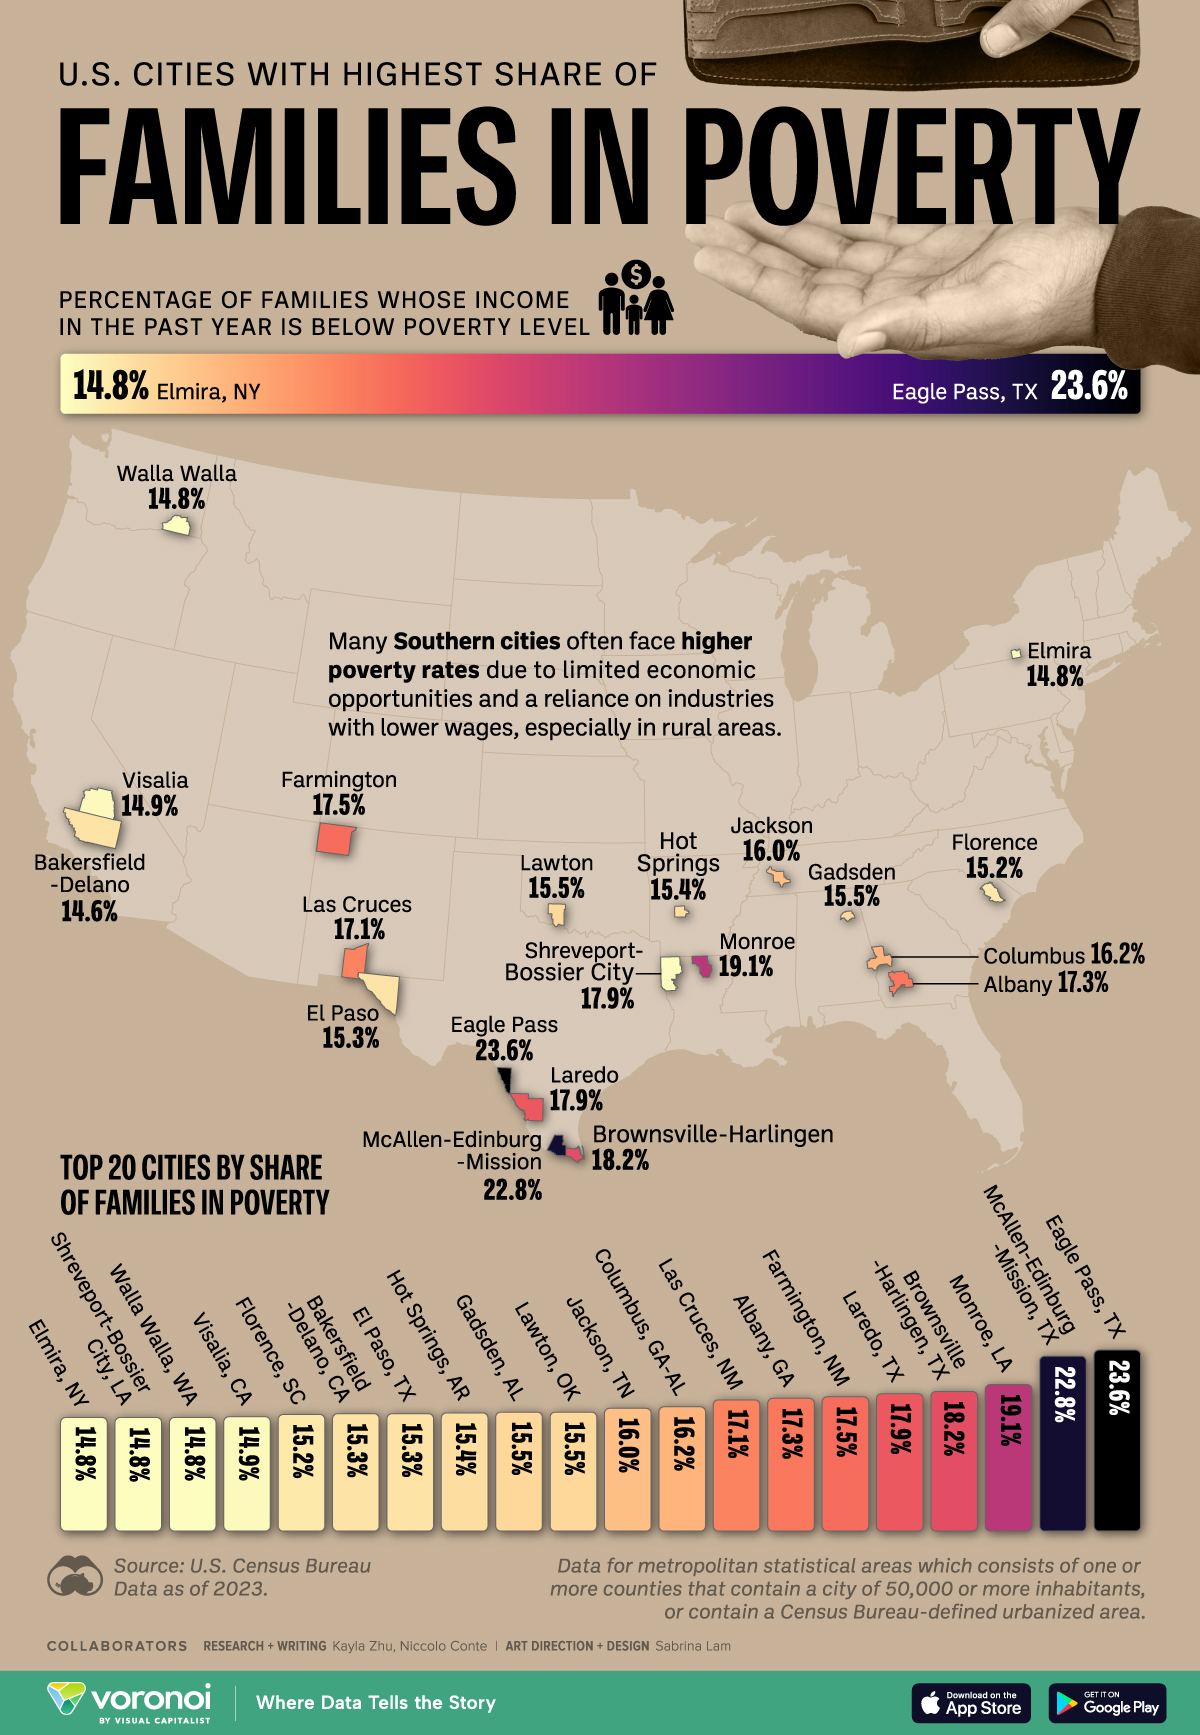
This map shows the top 20 U.S. metropolitan statistical areas by the percentage of families whose income in 2022 was below the poverty level.
The data comes from the U.S. Census Bureau and is updated as of 2023.
Metropolitan statistical areas (MSAs) consist of one or more counties that contain a contain a city of 50,000 or more inhabitants, or contain a Census Bureau-defined urbanized area.
Which U.S. Cities Have the Most Families Under Poverty Line?
Below, we show the top 20 cities U.S. metro areas by share of families whose income in 2022 was below the poverty line.
| Metropolitan statistical area | State(s) | Percentage of Families Below Poverty Level |
|---|---|---|
| Eagle Pass | Texas | 23.6 |
| McAllen-Edinburg-Mission | Texas | 22.8 |
| Monroe | Louisiana | 19.1 |
| Brownsville-Harlingen | Texas | 18.2 |
| Laredo | Texas | 17.9 |
| Farmington | New Mexico | 17.5 |
| Albany | Georgia | 17.3 |
| Las Cruces | New Mexico | 17.1 |
| Columbus | Georgia, Alabama | 16.2 |
| Jackson | Tennessee | 16.0 |
| Lawton | Oklahoma | 15.5 |
| Gadsden | Alabama | 15.5 |
| Hot Springs | Arizona | 15.4 |
| El Paso | Texas | 15.3 |
| Bakersfield-Delano | California | 15.3 |
| Florence | South Carolina | 15.2 |
| Visalia | California | 14.9 |
| Walla Walla | Washington | 14.8 |
| Shreveport-Bossier City | Louisiana | 14.8 |
| Elmira | New York | 14.8 |
Several metropolitan areas in the South and Southwest struggle with high family poverty rates, highlighting deep-rooted economic challenges.
In Texas, border cities such as Eagle Pass (23.6%), McAllen-Edinburg-Mission (22.8%), and Brownsville-Harlingen (18.2%) report some of the highest percentages of families living below the poverty line in the country.
Eagle Pass, which sits at the top of the list, is located on the U.S.-Mexico border and is known for being at the forefront of the U.S.’ migrant border crossing issue.
Louisiana’s Monroe (19.1%), New Mexico’s Farmington (17.5%), and Georgia’s Albany (17.3%) also face significant economic hardship, underscoring broader patterns of poverty in these states.
The persistently high poverty rates in these regions can be attributed to factors such as dependence on low-wage industries, lower educational attainment, and underinvestment in critical infrastructure and social services.
Learn More on the Voronoi App 
To learn more about poverty rates in the U.S., check out this graphic that visualizes poverty rates by state.

