![]() See this visualization first on the Voronoi app.
See this visualization first on the Voronoi app.
Chinese Products Most At Risk To U.S. Tariffs
This was originally posted on our Voronoi app. Download the app for free on iOS or Android and discover incredible data-driven charts from a variety of trusted sources.
With President Trump officially taking office for his second term, the threat of his proposed tariffs on Chinese imports is already imminent.
On January 22, Trump stated he was considering slapping a 10% tariff on all Chinese-made goods entering the U.S. as early as February 1st.
A blanket tariff on Chinese goods would introduce tariffs to certain industries for the first time, some which account for hundreds of billions of dollars of China’s exports to the United States.
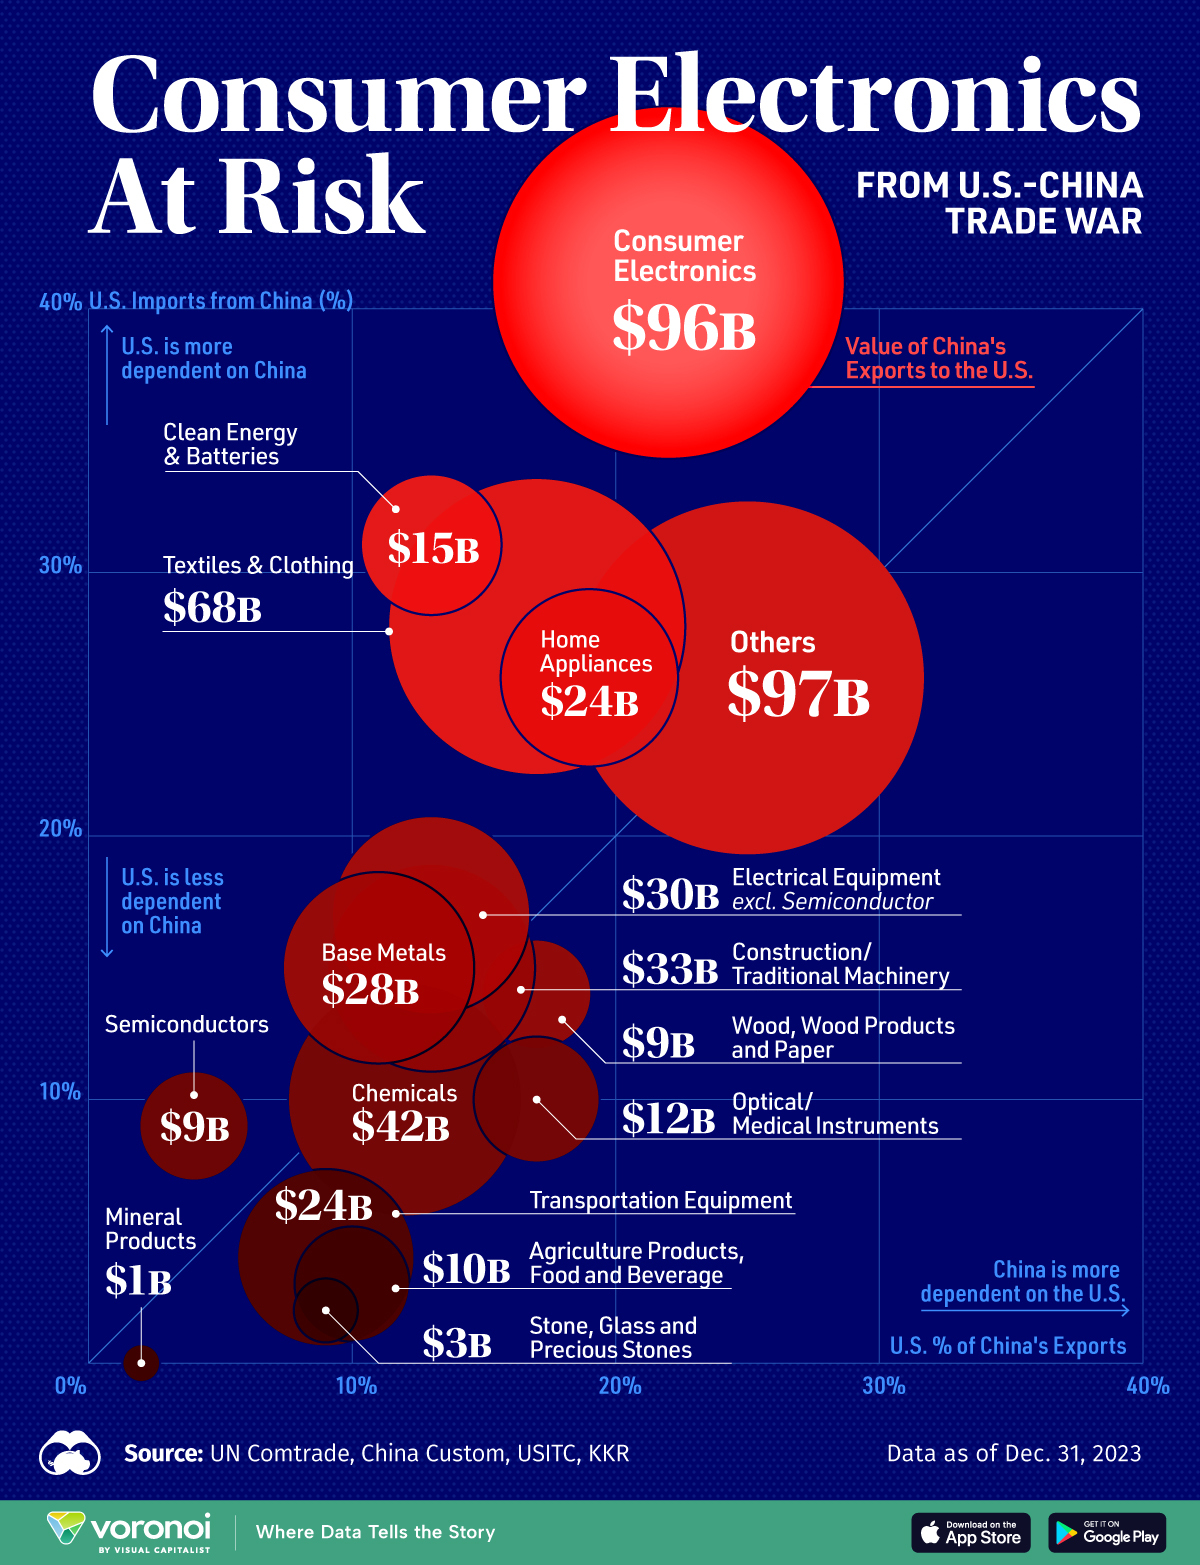
This graphic visualizes China’s exports to the U.S. in 2023 by sector, visualized through bubble sizes representing export values in billions of U.S. dollars.
The chart plots each sector based on its relative importance to both economies: the x-axis shows how dependent China is on U.S. markets for each sector, while the y-axis reveals how dependent U.S. is on Chinese imports.
The data sourced from UN Comtrade, China Custom, USITC via KKR as of Dec. 31, 2023.
Consumer Electronics At Risk
Below, for each sector we show the value of China’s exports to the U.S., the share of U.S. imports from China, and the share of China’s exports going to the United States.
| Sector | China Total Exports, 2023 (US$ Billion) | China’s Exports to U.S. | U.S. Imports from China |
|---|---|---|---|
| Consumer Electronics | 435 | 22% | 41% |
| Textiles and Clothing | 404 | 17% | 28% |
| Chemicals | 362 | 12% | 10% |
| Base Metals | 268 | 11% | 15% |
| Transportation Equipment | 265 | 9% | 4% |
| Construction/Traditional Machinery | 260 | 13% | 15% |
| Electrical Equipment (excl. Semiconductor) | 232 | 13% | 17% |
| Semiconductor | 201 | 4% | 9% |
| Home Appliance | 124 | 19% | 26% |
| Clean Energy & Batteries | 118 | 13% | 31% |
| Agriculture Product, Food and Beverage | 97 | 10% | 3% |
| Optical/Medical Instruments | 69 | 17% | 10% |
| Mineral Products | 68 | 2% | 0% |
| Wood, Wood Product and Paper | 51 | 17% | 14% |
| Stone, Glass and Precious Stones | 31 | 9% | 2% |
| Other | 395 | 25% | 26% |
| Total | 3,380 | 15% | 14% |
With $96 billion in exports and representing 41% of U.S. imports in this sector, consumer electronics stands as the most vulnerable industry in U.S.-China trade relations.
The sector’s positioning in the upper portion of the chart, along with textiles ($68 billion) and clean energy and batteries ($15 billion), indicates these industries are particularly dependent on Chinese imports, making them especially susceptible to Trump’s proposed tariff policies.
Consumer electronics like laptops, smartphones, tablets, video game consoles, TVs, and audio equipment will be impacted, with tariffs potentially raising prices by 26-45% and affecting billions in consumer spending.
Textiles and clothing is another major industry that will feel the impacts of U.S. tariffs, representing 17% of China’s exports to the U.S. and 28% of U.S. imports from China.
Chinese exports surged to a record high in 2024, with December seeing a 10.7% year-on-year increase, as manufacturers rushed to fulfill orders and companies ramped up shipments ahead of potential tariff hikes.
Learn More on the Voronoi App 
To learn more about international trade, check out this graphic that visualizes who the EU trades with.

