![]() See this visualization first on the Voronoi app.
See this visualization first on the Voronoi app.
Visualizing the Social Media Giants Dominating Ad Spend
This was originally posted on our Voronoi app. Download the app for free on iOS or Android and discover incredible data-driven charts from a variety of trusted sources.
Now in its 20th year, Facebook’s ad-based revenue model benefits from economies of scale, with nearly 250 million users averaging about 30 minutes on the platform each day.
Going further, Instagram users spend roughly twice the amount of time on the app daily. Both platforms, owned by Meta, expose users to ads that are based on targeted algorithms designed to boost advertisers returns on ad spend. Additionally, Meta is increasingly incorporating AI to enhance these ad-targeting capabilities.
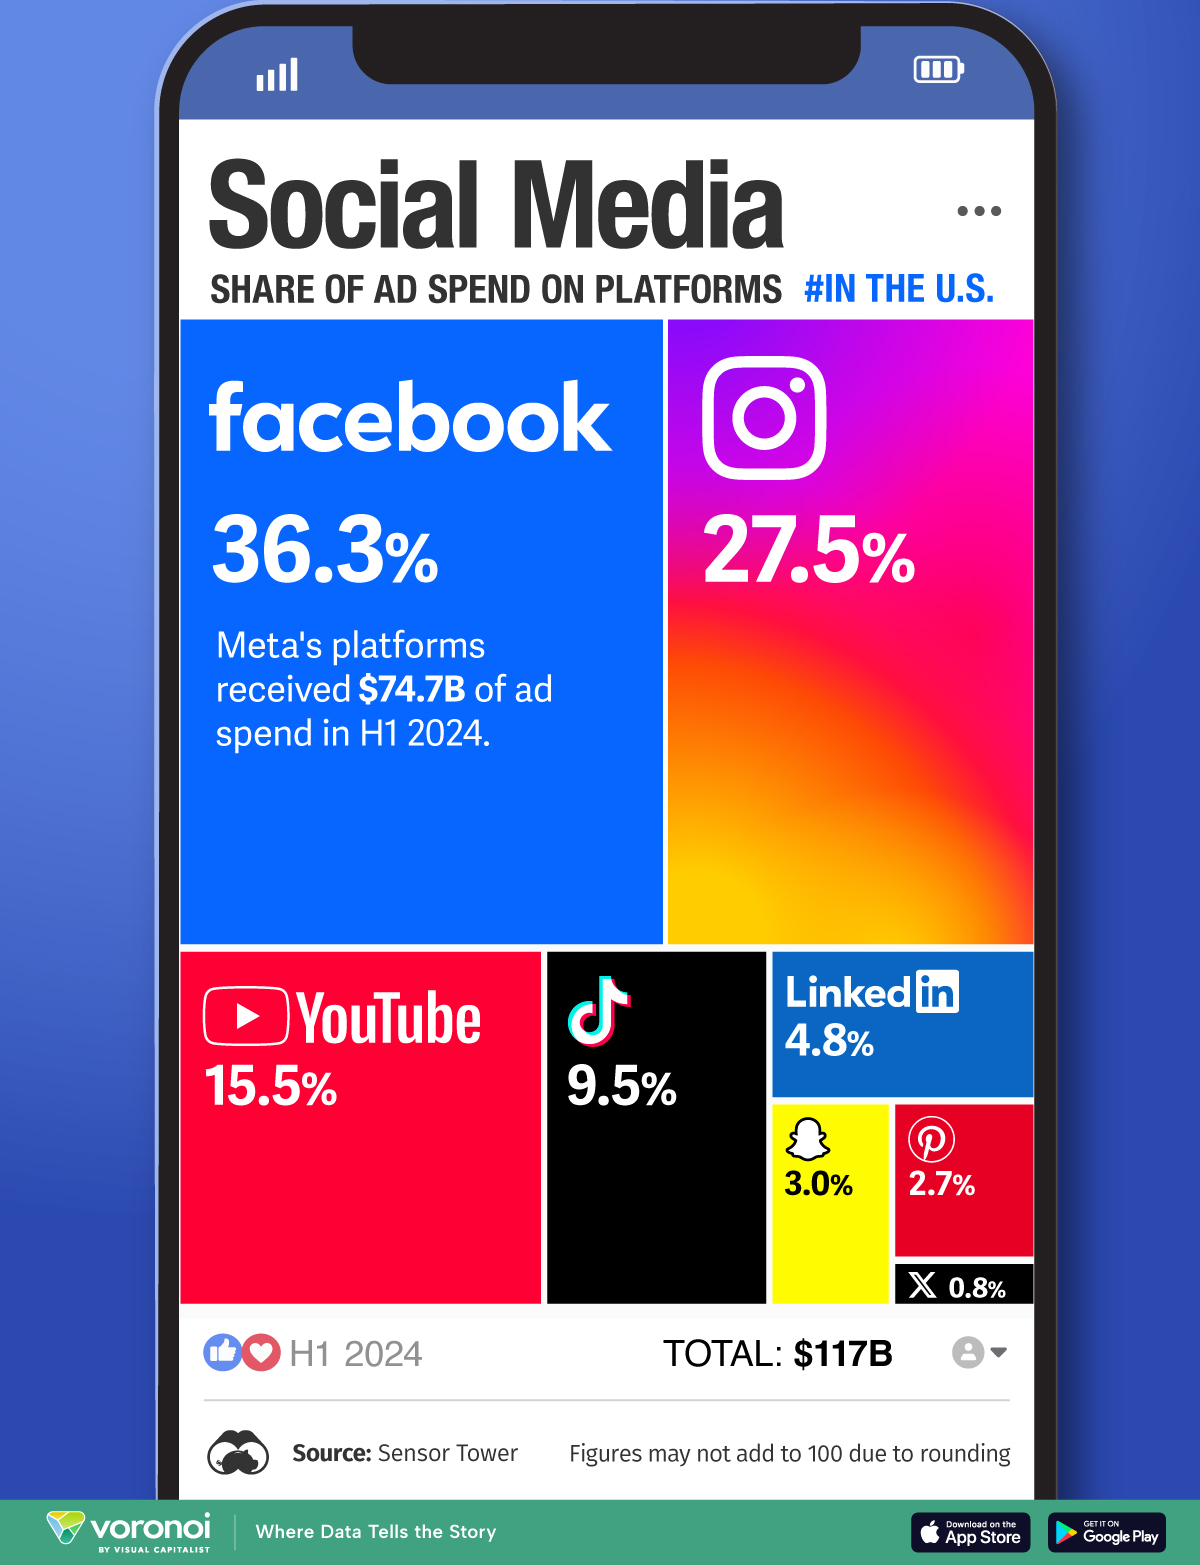
This graphic shows advertising spending across U.S. social media platforms, based on data from Sensor Tower.
Ranked: Where Advertisers Are Spending on Social Media
In the first half of 2024, more than two-thirds of U.S. ad spending went to Meta Platforms’ Facebook and Instagram, totaling nearly $75 billion.
This trend is seen across many countries globally, including Australia, France, Canada, and the UK. Meta’s Advantage+ feature enables advertisers to automate aspects of their campaigns, while the company utilizes AI to analyze optimal ad timing and placement to enhance conversion rates.
| Platform | Owner | Share of Digital Ad Spend H1 2024 | Value |
|---|---|---|---|
| Meta | 36.3% | $42.5B | |
| Meta | 27.5% | $32.2B | |
| YouTube | 15.5% | $18.1B | |
| TikTok | ByteDance | 9.5% | $11.1B |
| Microsoft | 4.8% | $5.6B | |
| Snapchat | Snapchat | 3.0% | $3.5B |
| 2.7% | $3.2B | ||
| X (formerly Twitter) | X | 0.8% | $0.9B |
| U.S. Total | 100.0% | $117.0B |
Figures may not total 100 due to rounding.
YouTube pulled in 15.5% of digital ad spend, falling in third by a wide margin.
This is likely due to the fact that YouTube has less versatility for ad formats along with less-targeted advertising capabilities. While YouTube can leverage Google’s vast scale of data, Meta has greater access to users interests, behaviors, and social networks.
Adding to this, Facebook ads can be comparatively more cost effective compared to long-form video ads found on YouTube’s platform.
Meanwhile, digital advertisers spent $11.1 billion on TikTok, owned by China’s ByteDance. Between January and August 2024, TikTok ad spend grew by 19% annually, the second highest overall after Instagram, at 27%. This led the short-form video platform to rank fourth overall in digital advertising spending, outpacing LinkedIn and Snapchat.
Overall, X saw $900 million in ad spend, a 23% drop compared to the same period last year. Looking ahead, roughly a quarter of advertisers plan to lower advertising spending on X in 2025—a record drop for the platform—due to worries about content moderation.
Learn More on the Voronoi App 
To learn more about this topic from a demographic perspective, check out this graphic on Gen Z’s favorite types of digital entertainment in 2024.

