![]() See this visualization first on the Voronoi app.
See this visualization first on the Voronoi app.
Mapped: Latin America’s GDP per Capita by Country
This was originally posted on our Voronoi app. Download the app for free on iOS or Android and discover incredible data-driven charts from a variety of trusted sources.
Latin America’s economic geography is vast and complex, spanning 24 countries across 8.1 million square miles.
Brazil and Argentina, among the region’s largest economies, are the most protectionist emerging markets globally. Mexico, by contrast, is expanding its role in global value chains. As America’s largest trading partner, U.S.-Mexico trade reached $798 billion in 2023.
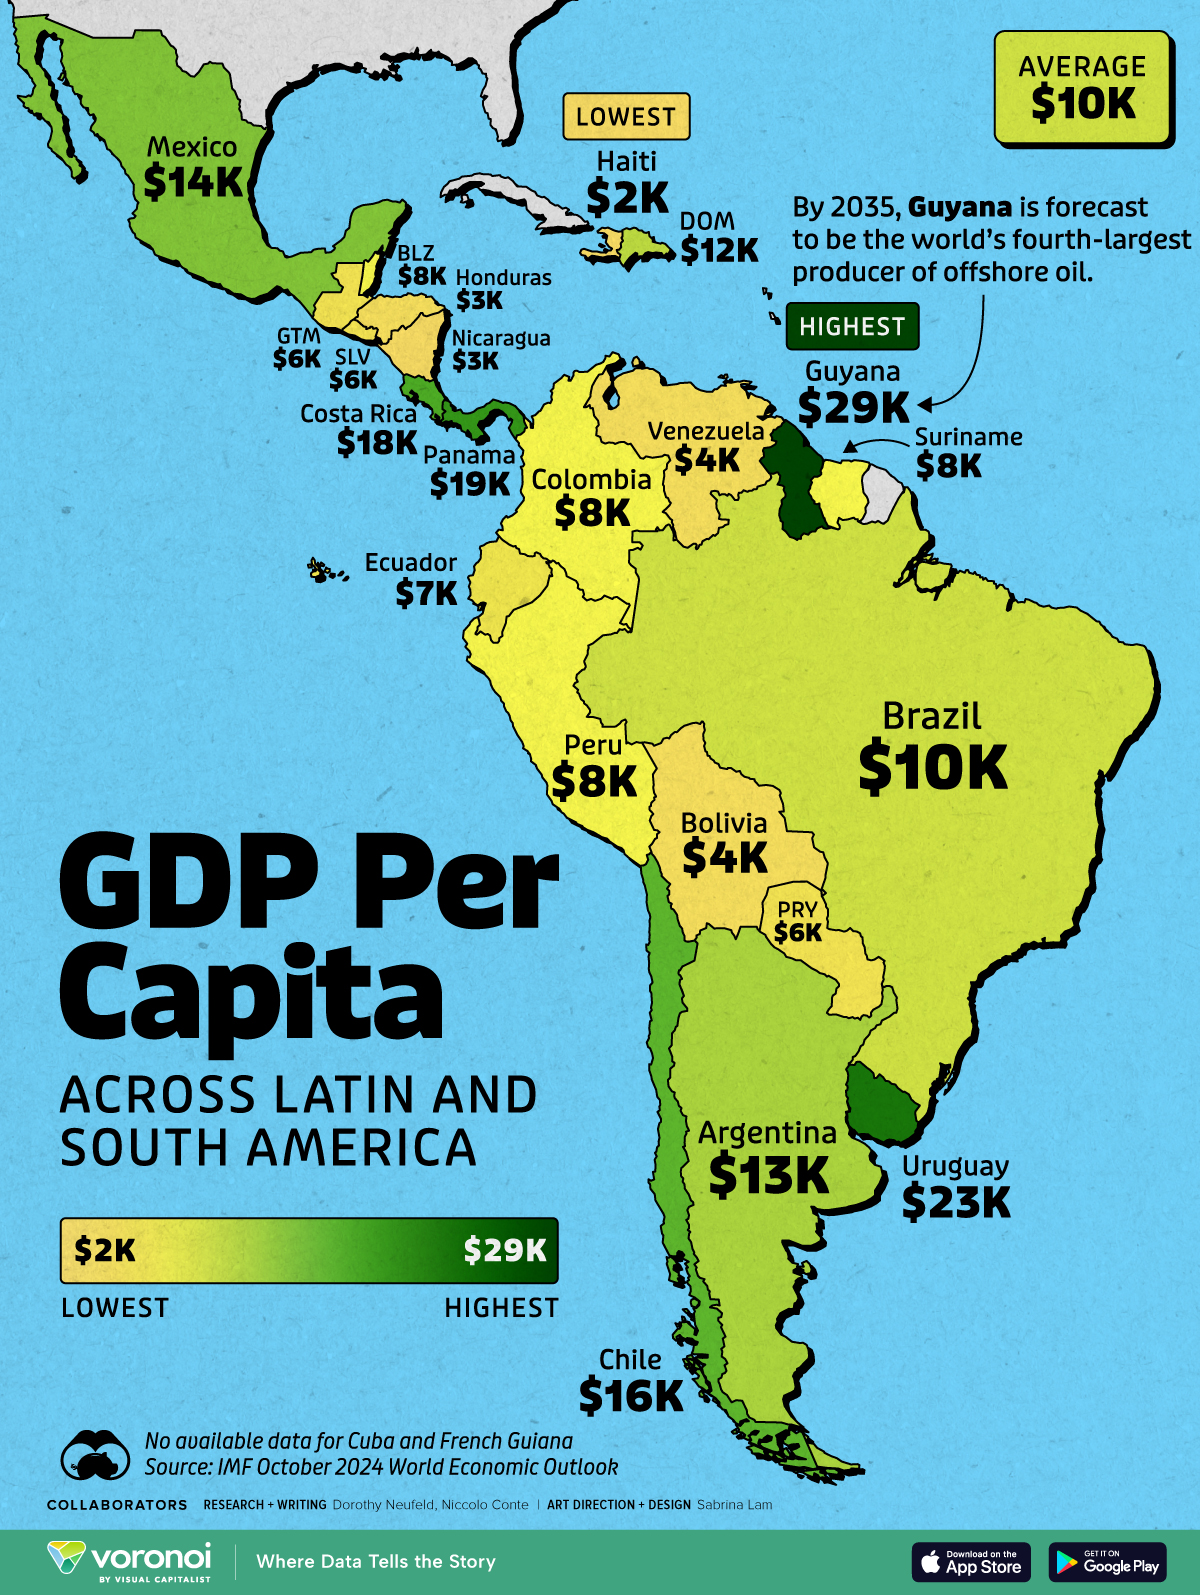
This graphic shows GDP per capita in South America, based on data from the IMF’s October 2024 World Economic Outlook.
Ranked: GDP per Capita in South America
Today, wealth across South America varies significantly, shaped by factors like economic structure, natural resources, and income distribution.
With a population of just 800,000 people, Guyana has the highest GDP per capita in South America, at $28,920, driven by its burgeoning oil industry. By 2035, Guyana is projected to become the world’s fourth-largest producer of offshore oil. Fueling this boom is a massive oil discovery by Exxon off the coast of Guyana in 2015.
As the table below shows, the region’s wealthiest nations often have smaller populations, allowing key industries to boost average incomes.
| Rank | Country | GDP Per Capita 2024 |
|---|---|---|
| 1 | 🇬🇾 Guyana | $28,920 |
| 2 | 🇺🇾 Uruguay | $23,053 |
| 3 | 🇵🇦 Panama | $19,369 |
| 4 | 🇨🇷 Costa Rica | $17,860 |
| 5 | 🇨🇱 Chile | $16,365 |
| 6 | 🇲🇽 Mexico | $13,972 |
| 7 | 🇦🇷 Argentina | $12,814 |
| 8 | 🇩🇴 Dominican Republic | $11,692 |
| 9 | 🇧🇷 Brazil | $10,296 |
| 10 | 🇵🇪 Peru | $8,316 |
| 11 | 🇧🇿 Belize | $8,133 |
| 12 | 🇨🇴 Colombia | $7,917 |
| 13 | 🇸🇷 Suriname | $7,600 |
| 14 | 🇪🇨 Ecuador | $6,758 |
| 15 | 🇬🇹 Guatemala | $6,295 |
| 16 | 🇵🇾 Paraguay | $5,869 |
| 17 | 🇸🇻 El Salvador | $5,607 |
| 18 | 🇻🇪 Venezuela | $4,019 |
| 19 | 🇧🇴 Bolivia | $3,920 |
| 20 | 🇭🇳 Honduras | $3,446 |
| 21 | 🇳🇮 Nicaragua | $2,878 |
| 22 | 🇭🇹 Haiti | $2,120 |
| Average | $10,370 |
No data available for Cuba and French Guiana
Following next in line is Uruguay, known for its stable political environment and low income inequality.
While economic growth has been slow over the past decade, Uruguay has low inflation and the highest trust in political parties in the region. As a country that strongly values moderation, Uruguayans recently rejected a referendum that would have dropped the retirement age by five years, fearing it would substantially widen the deficit.
Despite being Latin America’s second-biggest economy, Mexico ranks sixth in GDP per capita. While the economy is diversified across manufacturing, agriculture, and energy sectors, it also has high income inequality.
Looking ahead, if President-elect Trump imposes sweeping tariffs, Mexico could experience a decline in incomes and increased costs for American goods should the Mexican government enact retaliatory tariffs in response.
When it comes to Brazil, GDP per capita stands at $10,296—roughly a third of Guyana’s. While the country is the world’s largest exporter of soybeans, raw sugar, and coffee, wealth distribution is highly concentrated. As a result, Brazil has the highest income inequality in the region, with average wealth falling near the middle of the pack.
Overall, the lowest GDP per capita in South America is seen in Haiti. For decades, the country has faced gang violence, political instability, limited economic diversification along with high rates of poverty. Like Haiti, among the poorest nations in the region, including Nicaragua and Honduras, face similar obstacles to economic growth.
Learn More on the Voronoi App 
To learn more about this topic from a global perspective, check out this graphic on Africa’s GDP per capita by country.

