Mapped: Water Violations by State in 2023
This was originally posted on our Voronoi app. Download the app for free on iOS or Android and discover incredible data-driven charts from a variety of trusted sources.
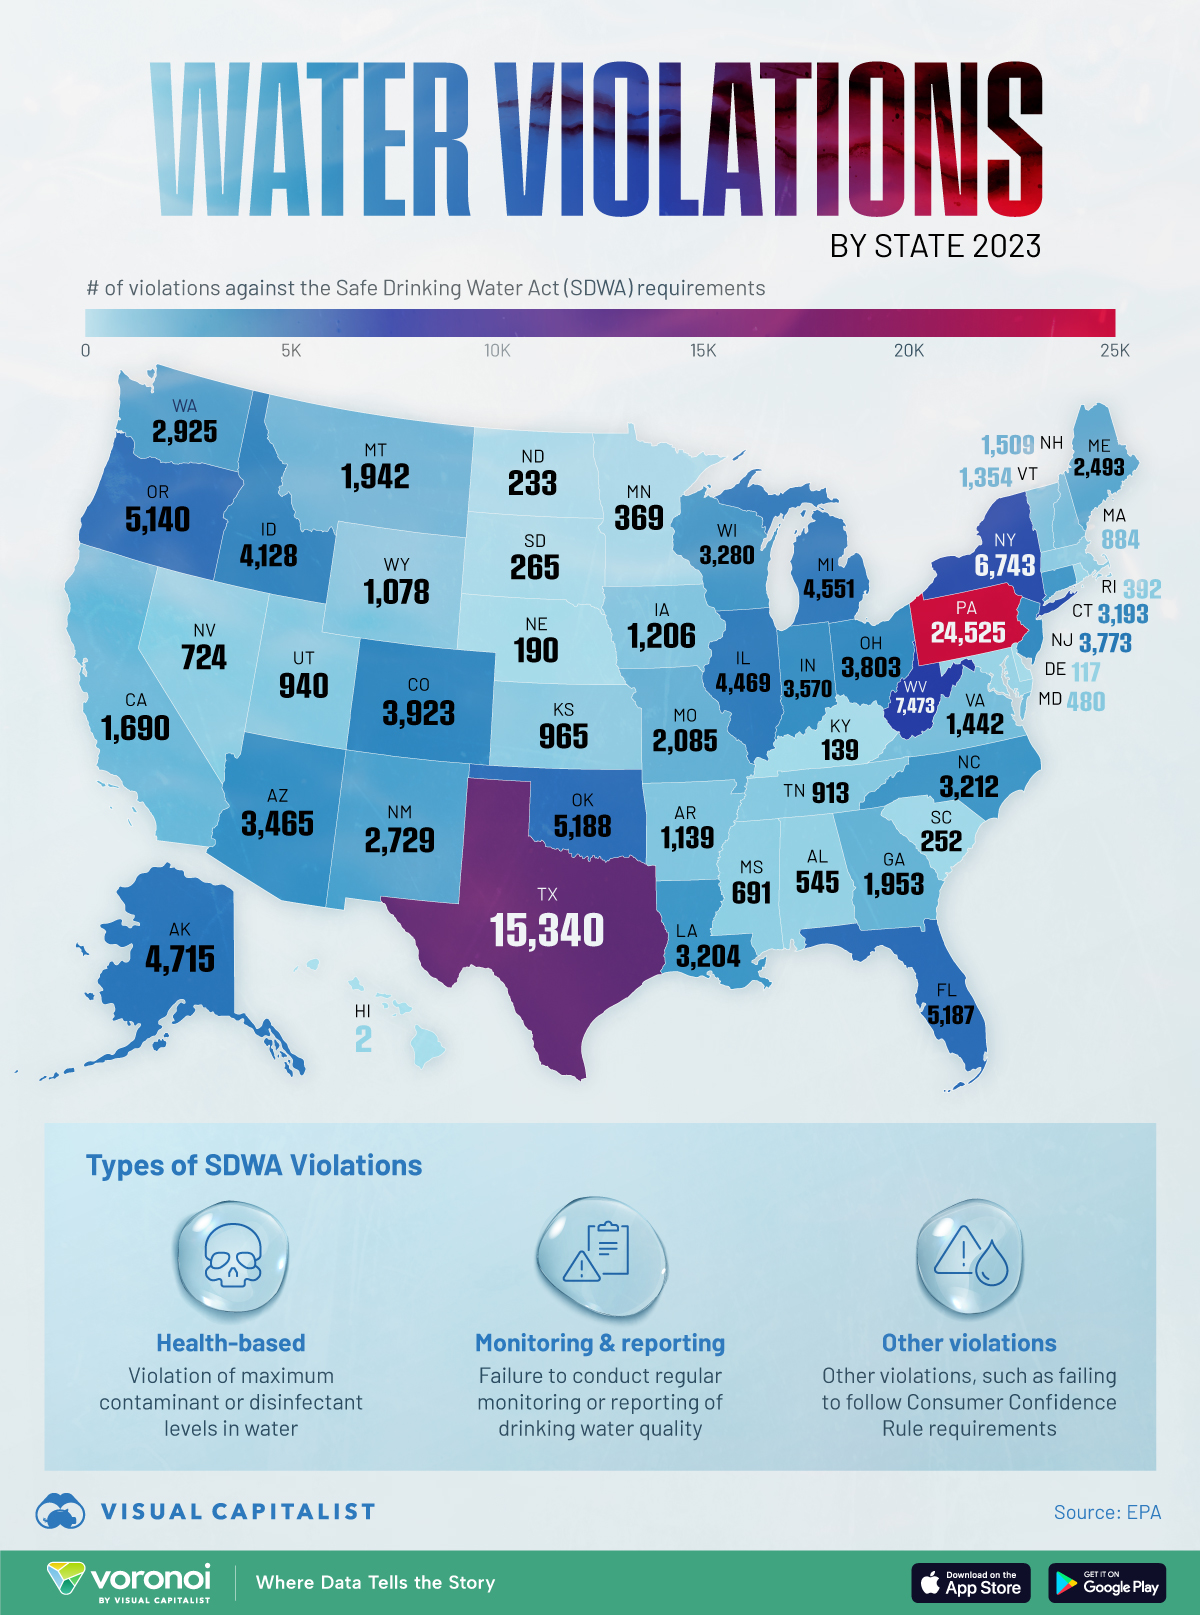
This map graphic shows the number of Safe Drinking Water Act (SDWA) violations each state received in 2023, based on official data from the Environmental Protection Agency (EPA).
In 2023, Pennsylvania had 24,525 violations, the highest number by a significant margin.
Data and Terminology
According to the EPA, water violations are sorted into three high level categories:
- Health-based: Includes violations regarding maximum contaminant or disinfectant levels in water
- Monitoring and reporting: Includes failures to conduct regular monitoring or reporting of drinking water quality
- Other violations: Includes failure to to issue consumer confidence reports, or conducting periodic sanitary surveys
Note that violations are assigned to the public water systems (PWSs) within each state, of which there are often thousands. For example, Texas has 7,293 PWSs.
A PWS is defined as a system for the provision to the public of water for human consumption through pipes or other constructed conveyances.
See below for the data we used to create this graphic:
| Rank | State | Total Violations in 2023 |
|---|---|---|
| 1 | Pennsylvania | 24,525 |
| 2 | Texas | 15,340 |
| 3 | West Virginia | 7,473 |
| 4 | New York | 6,743 |
| 5 | Oklahoma | 5,188 |
| 6 | Florida | 5,187 |
| 7 | Oregon | 5,140 |
| 8 | Alaska | 4,715 |
| 9 | Michigan | 4,551 |
| 10 | Illinois | 4,469 |
| 11 | Idaho | 4,128 |
| 12 | Colorado | 3,923 |
| 13 | Ohio | 3,803 |
| 14 | New Jersey | 3,773 |
| 15 | Indiana | 3,570 |
| 16 | Arizona | 3,465 |
| 17 | Wisconsin | 3,280 |
| 18 | North Carolina | 3,212 |
| 19 | Louisiana | 3,204 |
| 20 | Connecticut | 3,193 |
| 21 | Washington | 2,925 |
| 22 | New Mexico | 2,729 |
| 23 | Maine | 2,493 |
| 24 | Missouri | 2,085 |
| 25 | Georgia | 1,953 |
| 26 | Montana | 1,942 |
| 27 | California | 1,690 |
| 28 | New Hampshire | 1,509 |
| 29 | Virginia | 1,442 |
| 30 | Vermont | 1,354 |
| 31 | Iowa | 1,206 |
| 32 | Arkansas | 1,139 |
| 33 | Wyoming | 1,078 |
| 34 | Kansas | 965 |
| 35 | Utah | 940 |
| 36 | Tennessee | 913 |
| 37 | Massachusetts | 884 |
| 38 | Nevada | 724 |
| 39 | Mississippi | 691 |
| 40 | Alabama | 545 |
| 41 | Maryland | 480 |
| 42 | Rhode Island | 392 |
| 43 | Minnesota | 369 |
| 44 | South Dakota | 265 |
| 45 | South Carolina | 252 |
| 46 | North Dakota | 233 |
| 47 | Nebraska | 190 |
| 48 | Kentucky | 139 |
| 49 | Delaware | 117 |
| 50 | Hawaii | 2 |
Pennsylvania Leads
From this data we can see that Pennsylvania had the most violations in 2023. Out of the 24,525 violations, 14,808 were related to monitoring and reporting.
Furthermore, of the state’s 8,083 public water systems, 3,660 were found to have at least one violation in 2023 (45% of total PWSs).
Major Water Stories of 2024
There have been a number of major news stories regarding water safety in the U.S. this year.
For starters, residents of Flint, Michigan, reached a settlement with Veolia North America worth $25 million. This settlement is part of the ongoing efforts to hold parties accountable for the Flint water crisis.
Meanwhile, in Newark, New Jersey, a contractor has been accused of fraud for allegedly lying about replacing lead water pipes in the city.
High levels of lead exposure can cause high blood pressure, cardiovascular disease, difficulty with memory, and harm to reproductive health.
Learn More on the Voronoi App 
If you enjoyed this post, check out The Dirtiest Cities in the U.S. on Voronoi, the new app from Visual Capitalist.

