Which S&P 500 Sectors Hold the Most Cash?
This was originally posted on our Voronoi app. Download the app for free on iOS or Android and discover incredible data-driven charts from a variety of trusted sources.
The S&P 500 added more than $9.7 trillion to investor portfolios in 2024 as the index hit record highs.
Notably, the Magnificent Seven stocks drove 53.1% of the index’s gains, underscored by AI enthusiasm and healthy earnings growth. Moreover, these megacap companies have cash reserves that significantly surpass the majority of other S&P 500 companies.
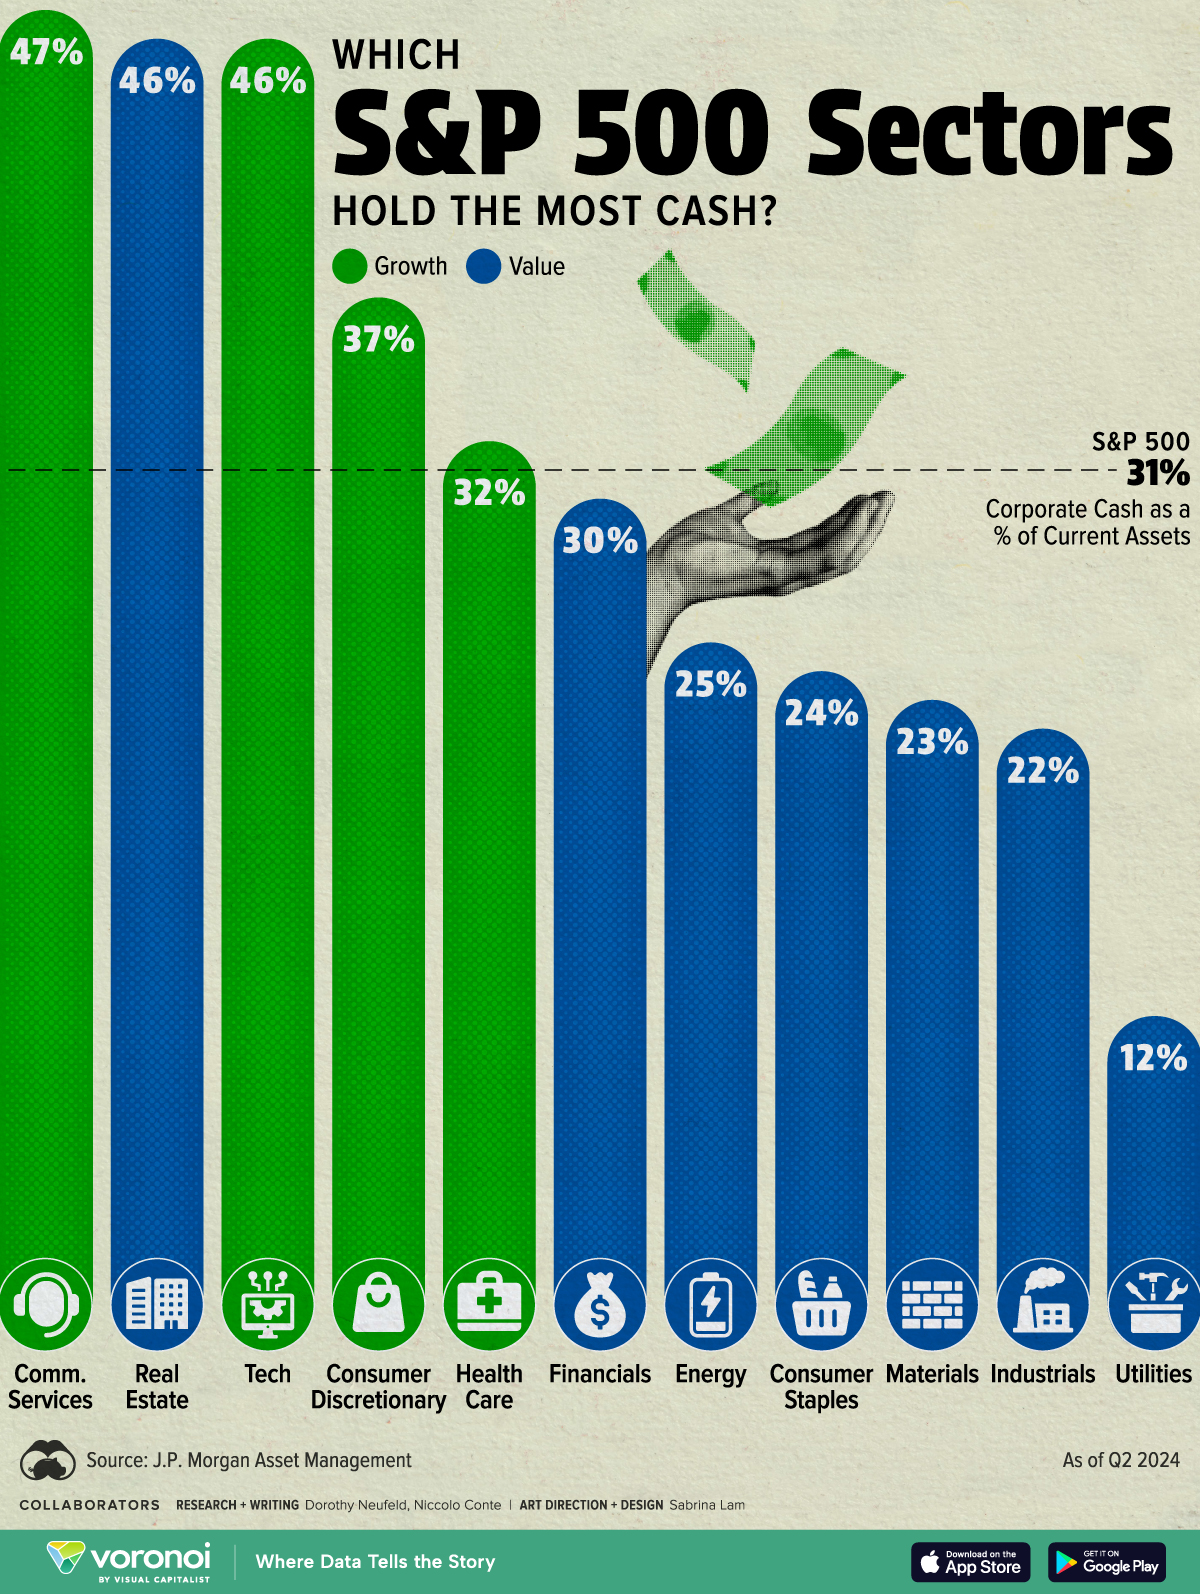
This graphic shows the S&P 500 sectors by their cash holdings, based on data from J.P. Morgan Asset Management.
Magnificent Seven Sectors Lead the Way
Below, we show the 11 S&P 500 sectors by their corporate cash as a percentage of current assets:
| S&P 500 Sector | Corporate Cash as a % of Current Assets Q2 2024 |
Category |
|---|---|---|
| Communication Services | 47% | Growth |
| Real Estate | 46% | Value |
| Tech | 46% | Growth |
| Consumer Discretionary | 37% | Growth |
| Health Care | 32% | Growth |
| Financials | 30% | Value |
| Energy | 25% | Value |
| Consumer Staples | 24% | Value |
| Materials | 23% | Value |
| Industrials | 22% | Value |
| Utilities | 12% | Value |
| S&P 500 | 31% |
The communication services sector stands above the rest, driven by significant cash holdings of Alphabet ($93 billion) and Meta ($71 billion) as of December 13, 2024.
On corporate balance sheets, cash includes cash deposits in addition to investments like Treasuries, commercial paper, and money-market funds with maturities of three months or less. During a period of elevated interest rates, cash-rich companies can benefit from the interest earned on their cash holdings.
For instance, Alphabet’s interest and investment income reached $3.9 billion in 2023, up 78% over the year. Meanwhile, Meta Platforms earned $1.6 billion on its cash holdings that year.
Ranking in second is the real estate sector, with corporate cash making up 46% of current assets. This is due to the fact that companies in the sector largely invest in non-current assets including properties and land, which leads its cash as a share of current assets to be higher than the majority of sectors.
Following next in line is the information technology sector, driven by Magnificent Seven companies Microsoft and Apple. Both tech giants rank among the top 10 companies in the S&P 500 with the most cash on hand, fueled by their high margins and strong profitability.
By contrast, the utilities sector ranks at the bottom of the list, with corporate cash accounting for 12% of current assets. As a traditionally defensive sector, utilities firms often prioritize redirecting cash toward dividend payments rather than retaining it on the balance sheet, pushing this figure lower.
Learn More on the Voronoi App 
To learn more about this topic from a performance-based perspective, check out this graphic on S&P 500 returns by sector in 2024.

